How do you read a reliability diagram for storm probabilities?
A reliability diagram plots the average forecast probability on the horizontal axis and the observed frequency on the vertical axis. A point above the diagonal indicates the event occurred more often than the forecast probability in that bin.
Start with Brier score practice for probabilistic supercell forecasts.
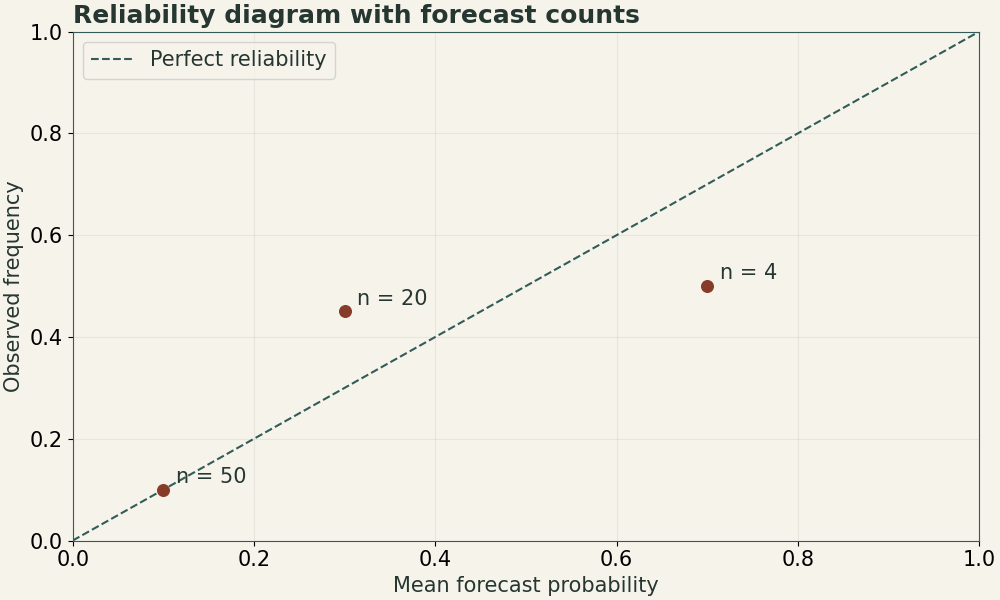
| Probability group | Number of forecasts | Observed events | Plotted point |
|---|---|---|---|
| 0.10 | 50 | 5 | (0.10, 0.10) |
| 0.30 | 20 | 9 | (0.30, 0.45) |
| 0.70 | 4 | 2 | (0.70, 0.50) |
Worked example
Group forecasts into probability bins and compute the average prediction and observed event fraction inside each bin. Record bin counts because a point built from a few cases can move a lot when one case changes. In our synthetic 30% group, 9 of 20 windows verify, giving observed frequency 0.45 and calibration point (0.30, 0.45). The observed frequency exceeds the forecast mean by 0.15, or 15 percentage points.
Practice questions
- What is the observed frequency for the 70% bin? How should you interpret it?
- One event classification changes from yes to no in each of the 10% and 70% bins. Which point moves more?
Worked answers
Answer 1
2/4 = 0.50. The sample point lies below the diagonal, with only four cases supporting it.
Answer 2
The 10% group moves by 1/50 = 0.02. The 70% group moves by 1/4 = 0.25. Keep sample sizes visible.
- 2/4 = 0.50. The sample point lies below the diagonal, with only four cases supporting it.
- The 10% group moves by 1/50 = 0.02. The 70% group moves by 1/4 = 0.25. Keep sample sizes visible.