A History of Tornadoes in Miami
How Miami, Florida's geography shapes tornado risk, with important city and regional events.
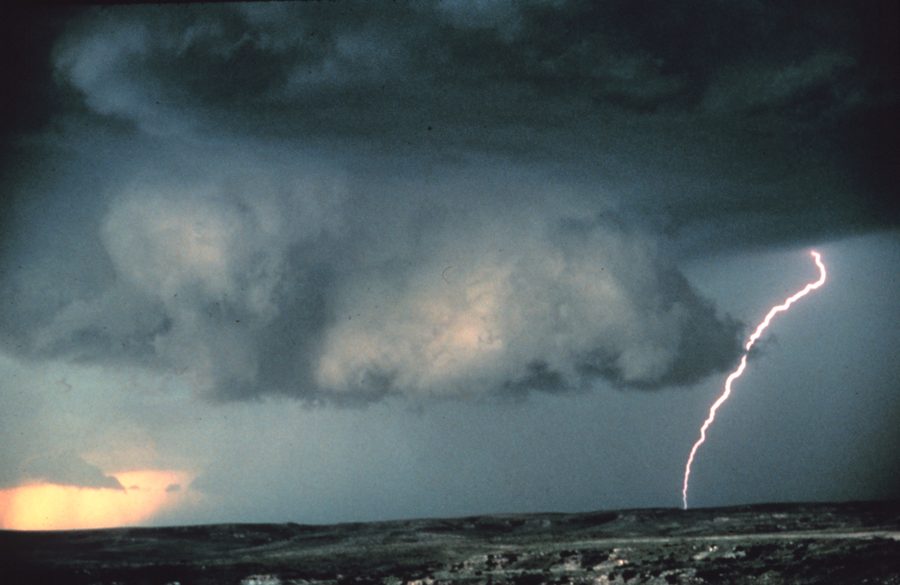
Geography and storm exposure
Miami is part of the Florida peninsula and Gulf–Atlantic coastal zone. Sea-breeze collisions, winter storm systems and tropical rain bands can produce brief tornadoes. Geography influences storm boundaries and exposure, but terrain, rivers and buildings do not create a dependable tornado shield.
Waterspouts moving ashore and rain-wrapped tropical tornadoes are part of the local record. This page uses the incorporated city as its population reference and the surrounding region for meteorological context; those boundaries answer different questions and are labeled separately.
#41 in the United States
489,812
year-round, especially the cool season and hurricane season
Important tornadoes to place in context
1925 Miami tornado
A documented city or regional event that helps explain the local historical record.
1997 downtown Miami tornado
A documented city or regional event that helps explain the local historical record.
tornadoes associated with tropical cyclones
A documented city or regional event that helps explain the local historical record.
These events are starting points, not a claim that every path crossed Miami's incorporated limits. Tornadoes are surveyed by path and county; metropolitan labels in news coverage often describe a broader area.
Why the historical record changes over time
Older records favor destructive tornadoes that crossed settled places. Radar, trained spotters, phones and systematic damage surveys now capture many weak or brief events that earlier observers could miss. Apparent increases can therefore reflect detection and urban growth as well as weather variability.
Official sources
- NOAA Storm Events Database
- Storm Prediction Center climatology
- National Weather Service tornado safety
- Census Vintage 2025 city estimates
This educational article is not a live warning service. Use official alerts for current decisions.