How do I read low-end and high-end nor’easter snow forecasts?
Low- and high-end maps show amounts near the lower and upper tails of the snowfall distribution. Compare both with the official expected snowfall map at the same location and for the same period.
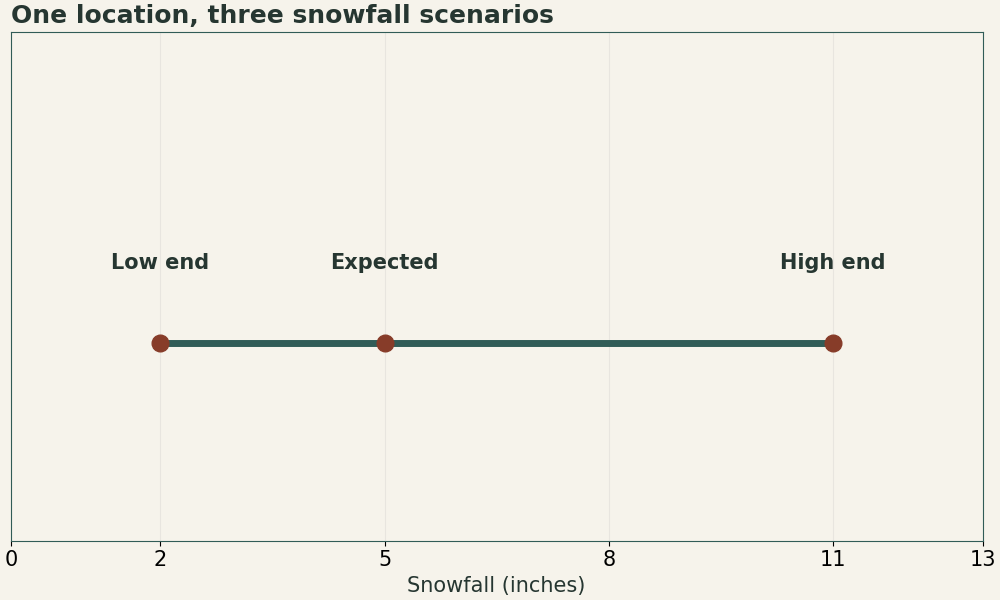
| Map | Illustrative amount | Interpretation for the same point and period |
|---|---|---|
| Low end | 2 in | Most outcomes reach this amount |
| Expected | 5 in | Official forecast amount |
| High end | 11 in | An upper-tail scenario that some outcomes exceed |
How it works
The NWS probabilistic snowfall suite can label the low end as an amount with a 90% chance of meeting or exceeding it, and the high end as an amount with a 10% chance of meeting or exceeding it. Read the exact wording on your local product. The expected map represents the official forecast and need not equal the numerical midpoint between the tails.
How can a reader use the upper scenario?
Compare 11 inches with the amount that would disrupt your travel or operations. Then look up the probability of reaching that specific threshold. The range can be asymmetric when the town is close to a rain–snow line or a narrow snow band.