Does El Niño mean more nor’easters or more snow?
See what NOAA snowfall composites show about El Niño in the Mid-Atlantic and northern New England, and how to interpret them for nor’easters.
El Niño can shift the odds of a snowier winter in some places. A snowfall composite averages the snow response across selected winters. To answer whether El Niño produces more nor’easters, you would need a separate database that counts comparable coastal storms.
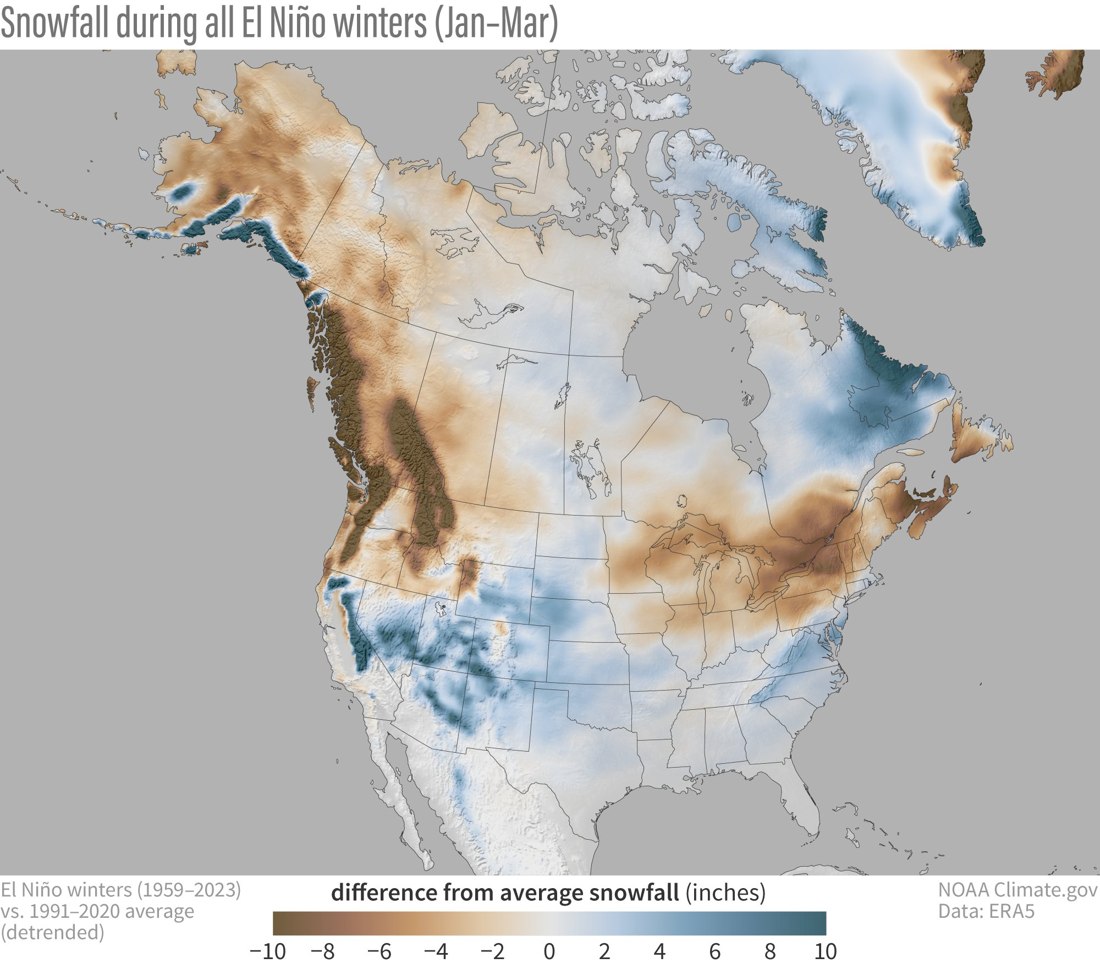
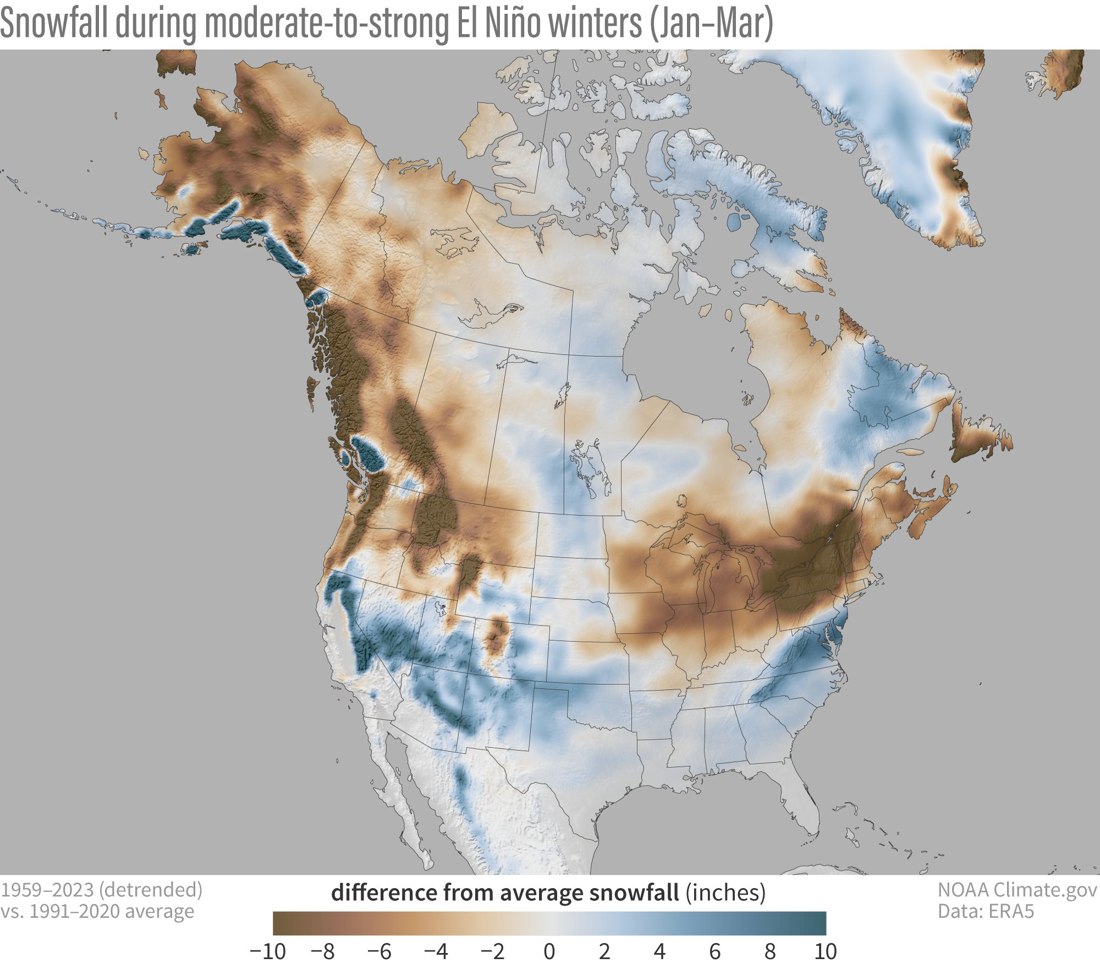
What NOAA averaged
The NOAA ENSO Blog analysis uses ERA5 data from 1959–2023. It examines January–March snowfall after removing the long-term trend from the composite data. A combined moderate-to-strong group uses 11 events. A map of averages can be influenced by a few very snowy years, especially in smaller strength groups.
Two maps answer different questions
The departure map asks how far the average across those winters was from the baseline. The below-average winter count map asks how often snowfall was below average in the same event group. If ten winters are 1 inch below average and an eleventh is 15 inches above, the mean departure is about +0.45 inches even though ten out of eleven winters were below average. Those numbers illustrate the arithmetic.
Why snow and storm counts can diverge
Two winters can have the same number of coastal storms and very different snowfall. A slight change in storm track can put a town in warmer onshore flow. A single heavy band can also contribute much of one town’s seasonal total. A study of storm frequency would need a common storm definition and track archive before comparing El Niño winters with a reference group. See the latest CPC ENSO discussion for the issued assessment.